Free dashboard template
A dashboard for the numbers that show whether your product is healthy.
Type in your headline numbers each week and month, paste in channel and cohort detail, and the workbook does the math and flags what’s off target. A Notion import pack comes with it.
- Workbook for Excel and Google Sheets
- Notion import pack: databases, pages and setup steps
- Free. You give us an email address, and that’s the whole price
Send me the template
Free download. No sales call at the end.
What happens to my email?
What we collect: your email address, and your first name if you give it.
Why: to send you the download. If you tick the box, also to send articles, new free resources and any paid products.
Your choices: unsubscribe from any email, or email us to withdraw consent or to ask us to correct or delete your data.
Concerns: email us. Full details are in our Privacy Policy.
Before you download
It’s free
You give us an email address and we send the files. The marketing emails are optional and separate. You get the download either way.
How you can use it
Use it on your own work and your clients’. Print it and fill it in. Don’t resell it, post it elsewhere or put it inside another product. Send people to this page instead.
What it is, and isn’t
General information, not legal, financial, security or other professional advice. It comes as is, with no warranty and no promised result. The examples and numbers are made up. To the extent the law allows, Eddie Gear isn’t liable for losses from using it. Spreadsheets can contain errors, and your inputs decide the outputs. Check formulas and results against your own records.
Your data
We use your email to send the download. We don’t sell your data. You get marketing emails only if you tick the box, and every email has an unsubscribe link. Analytics cookies are set only if you accept them.
Read the full Terms of Use and Privacy Policy. Tool names belong to their owners, and there’s no affiliation with any of them. Edition 1, 2026. Questions? Email us.
What’s in the download
It’s a template, not a live feed. It updates when you type or paste numbers. It isn’t connected to your tools.
Four areas on one sheet
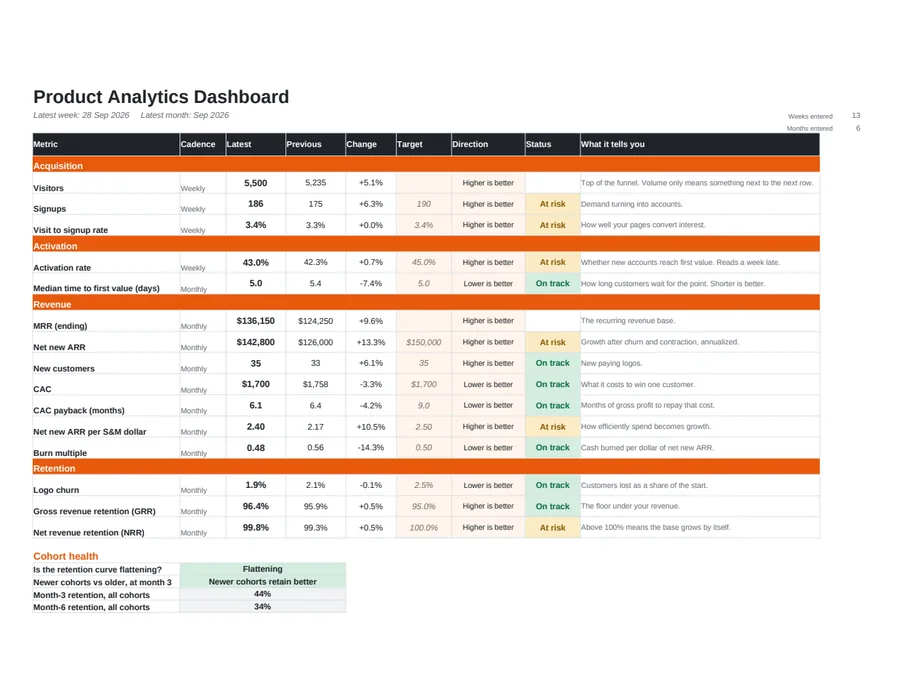
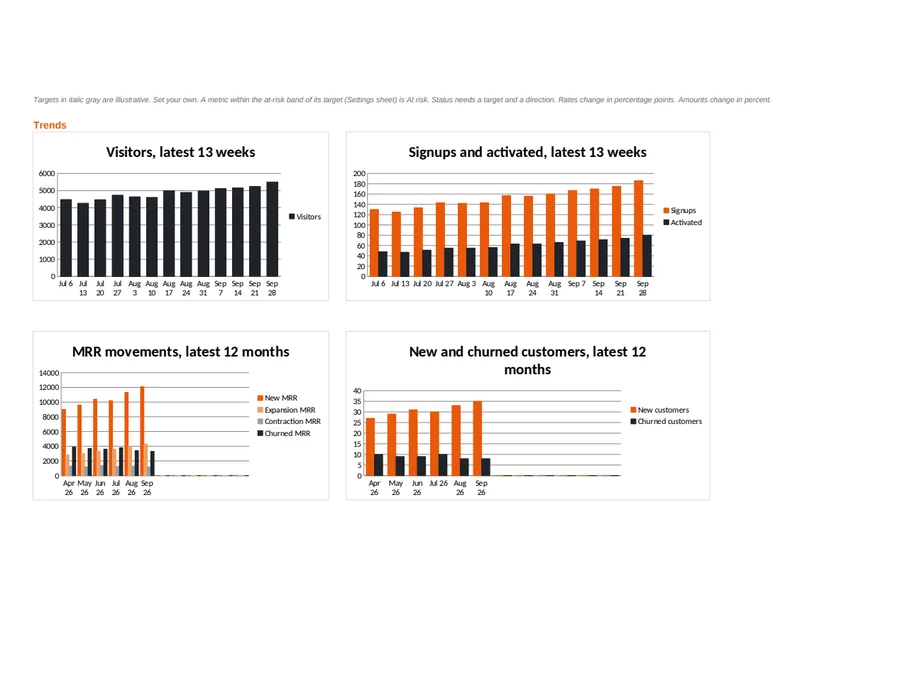
Acquisition, activation, retention and revenue, each with the latest figure, the previous one, the change, a target and a status. Four trend charts sit below.
Paste it in, get answers
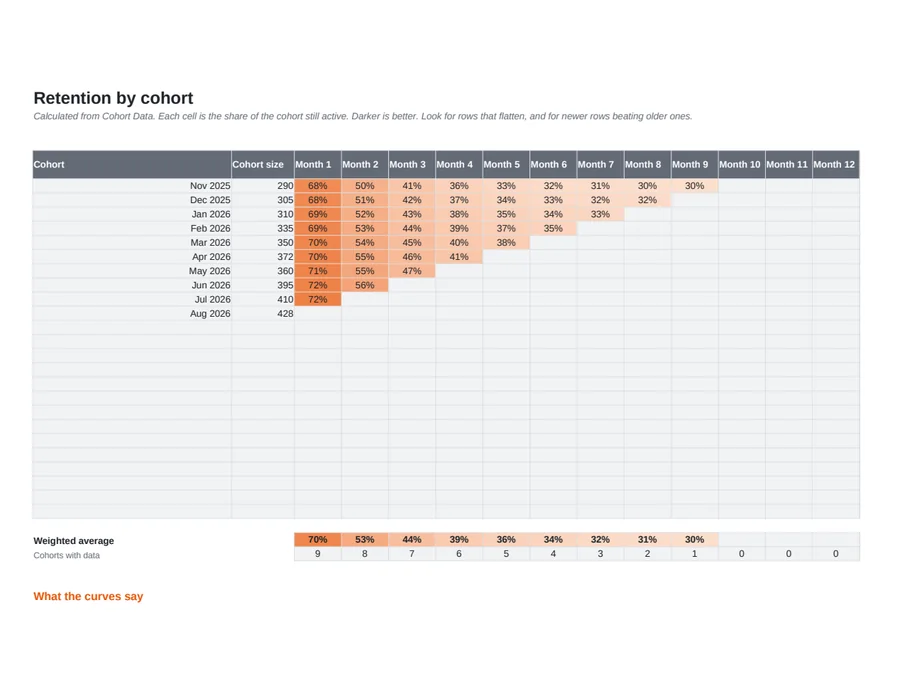
See which channels earn their spend. Paste a cohort table to get a retention heatmap and a test for whether the curve flattens.
Five databases, two pages
Imports into Notion with step-by-step setup. Setup takes about 45 minutes the first time, and the formulas are yours to add.
What the dashboard shows
Each line has a target and a direction. A status appears when you set them. The numbers below are example data, so overwrite them with yours.
| Metric | Latest | Previous | Status |
|---|---|---|---|
| Visit to signup rate | 3.4% | 3.3% | At risk |
| Activation rate | 43.0% | 42.3% | At risk |
| CAC payback (months) | 6.1 | 6.4 | On track |
| Logo churn | 1.9% | 2.1% | On track |
| Net revenue retention | 99.8% | 99.3% | At risk |
Example data, from the workbook.
How it works
Set your assumptions
Check four settings: the at-risk band, default gross margin and two retention thresholds. The defaults are only starting points.
Type your headline numbers
One row per week for the funnel, one per month for revenue and retention.
Paste channel and cohort detail
Paste one row per channel per month, and your cohort table. The workbook builds the summary and the heatmap.
Read the dashboard
Set a target and a direction for each metric, then read the status column from the top.
Who it’s for, and who it isn’t
For you if
Founders, product managers and growth leads who want one place to see product health, without building a BI stack.
Not for you if
You need live data from your tools. This updates when you type or paste numbers, and it isn’t connected to anything.
A look inside
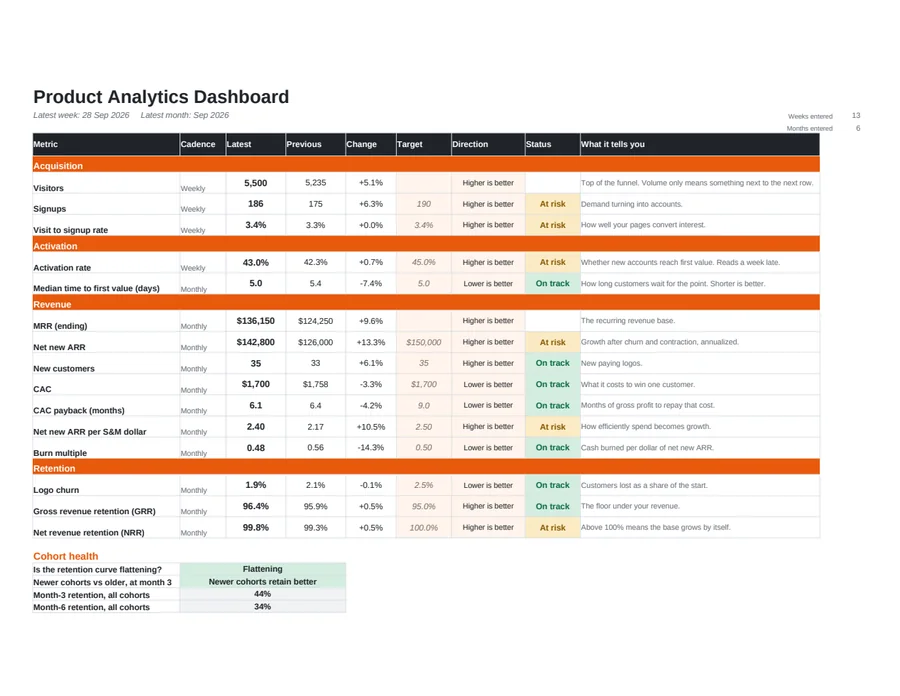
These are real pages from the download.
Questions
Is it really free?
Yes. You give us an email address and we send you the files. If you tick the box, we’ll also send you an email now and then. If you don’t tick it, you still get the files.
Is it live?
No. It updates when you enter or paste numbers. It isn’t connected to your tools.
Do I need both the workbook and Notion?
No. The workbook does the calculating. Notion suits teams that want the numbers, owners and notes in one shared place. Use either.
How long does setup take?
A first pass in the workbook takes about an hour. The Notion setup takes about 45 minutes the first time.
Can I use it with clients?
Yes. Use it on your own work and on your clients’. Please don’t resell it or post it elsewhere. Send people to this page instead.
How do I print it?
The download includes a print-friendly version. It’s designed for US Letter paper. On A4, choose “Fit to page.”
What do you do with my email?
We send you the files. If you ticked the box, we also send occasional emails about articles, new free resources and any paid products. You can unsubscribe from any email. The details are in the Privacy Policy.
Is this professional advice?
No. It’s general information and education. It isn’t legal, financial, security or other professional advice, and it comes with no warranty and no promised result. Check anything important against your own situation.
Are the examples real?
No. The names, numbers and scenarios marked illustrative or composite are made up to show how it works. They aren’t benchmarks, and they aren’t anyone’s results.
Who made this?
Eddie Gear. It’s drawn from years of hands-on experience, and it names no clients, on purpose.
Know how your product is doing, in a first pass of about an hour.
Send me the template
Free download. Check your inbox after you sign up.
What happens to my email?
What we collect: your email address, and your first name if you give it.
Why: to send you the download. If you tick the box, also to send articles, new free resources and any paid products.
Your choices: unsubscribe from any email, or email us to withdraw consent or to ask us to correct or delete your data.
Concerns: email us. Full details are in our Privacy Policy.